

Reporting & Analytics
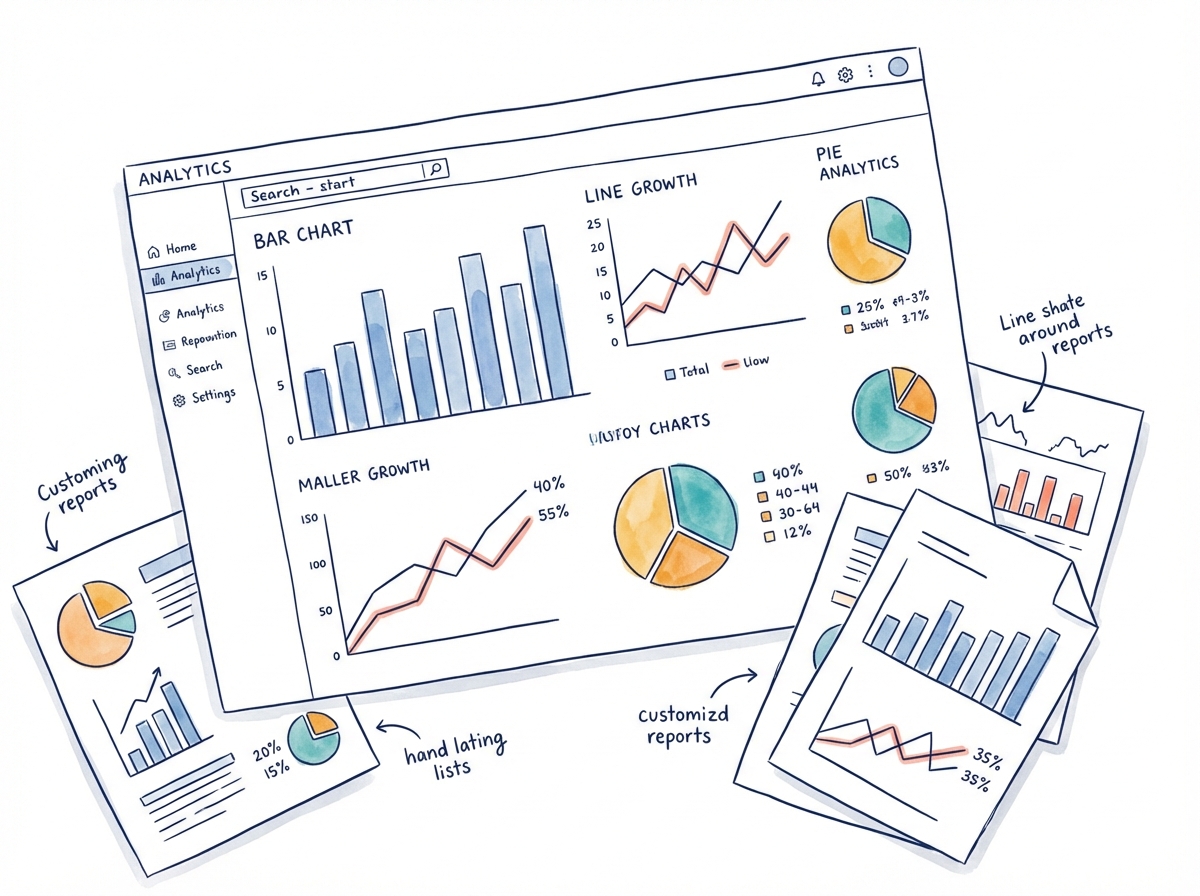
Your reports are built as part of the project: branded, structured around your debrief process, and generated automatically as assessments complete. Individual reports, group analytics, and benchmarking, all in your visual identity.
Branded Individual Reports
We build your feedback reports from scratch: cover page, section structure, charts, and the way they read, so they look like your own work.
- Custom cover pages, layouts, and section ordering
- Bar graphs, spider diagrams, frequency tables, and gap analysis
- Verbatim open-ended comments organised by rater group
- Development suggestions and action planning sections
Norms & Benchmarking
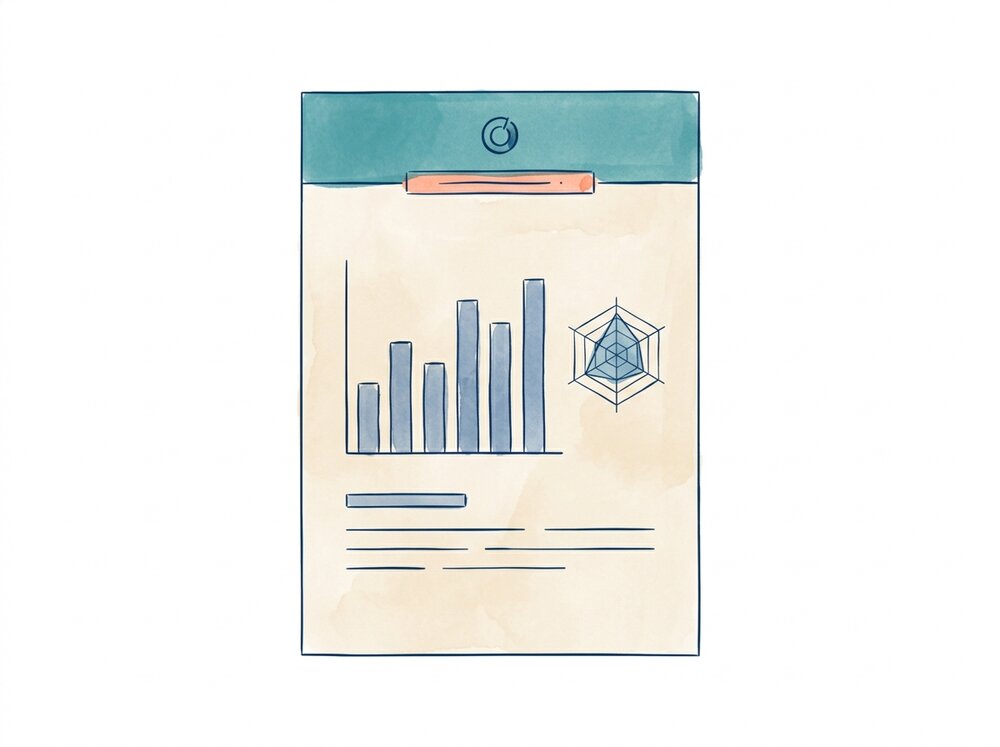
Reports can include norm comparisons, so participants see how their scores sit against relevant benchmark groups. That context makes the feedback land better.
- Norm sets with average scores, standard deviations, and sample sizes
- Norm comparisons displayed alongside rater group scores
- Multiple norm sets available per tool (e.g., industry, role level)
- Pre/post comparison for longitudinal programs
Group & Campaign Analytics
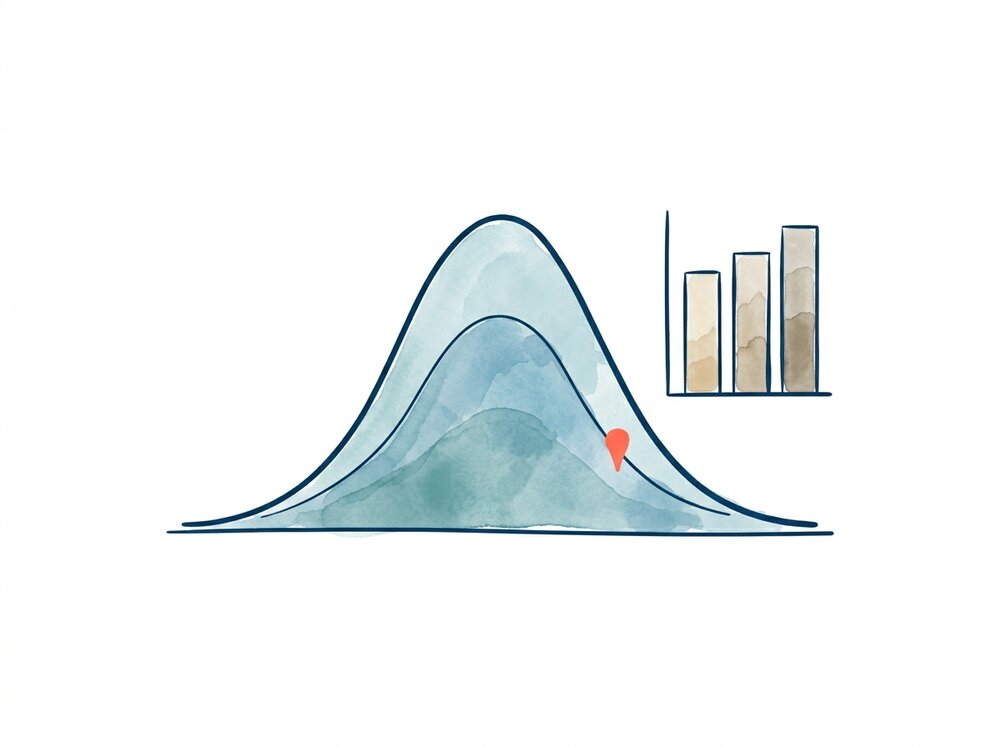
Aggregate reporting across a campaign or cohort: spot organisational themes, compare demographic segments, and show patterns across a program.
- Campaign-level aggregate reports across all participants
- Demographic segmentation and filtering
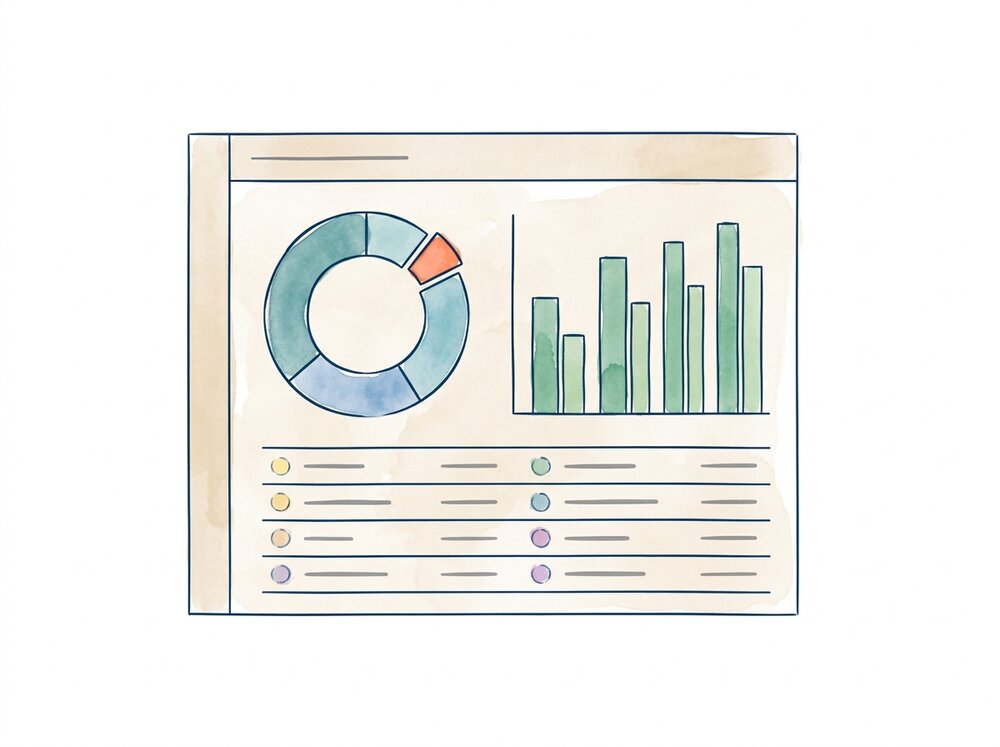
- Reporting dashboard with role-based access control
- Batch report generation and download as ZIP

See how it works for your firm
Book a personalized demo and we'll show you how all these features work together to power your 360 programs.
